
Education
The education data below is sourced from the National Government’s Race Disparity Audit (RDA) and the Office for National Statistics (ONS), and includes raw data as well as graphs and data summaries covering the following areas:
RDA
Percentage of 4- to 5-year-olds who met the expected standard in development (2018 to 2019 School Year)
Phonics attainments for children aged 5 to 7 (KS1)
Reading attainments for children aged 6 to 7 (KS1)
Writing attainments for children aged 6 to 7 (KS1)
Mathematics attainment for children aged 6 to 7 (KS1)
Science attainment for children aged 6 to 7 (KS1)
Reading attainment for children aged 10 to 11 (KS2)
Writing attainment for children aged 10 to 11 (KS2)
Mathematics attainment for children aged 10 to 11 (KS2)
Reading, writing and maths attainment for children aged 10 to 11 (KS2)
Grammar, punctuation, and spelling attainment for children aged 10 to 11 (KS2)
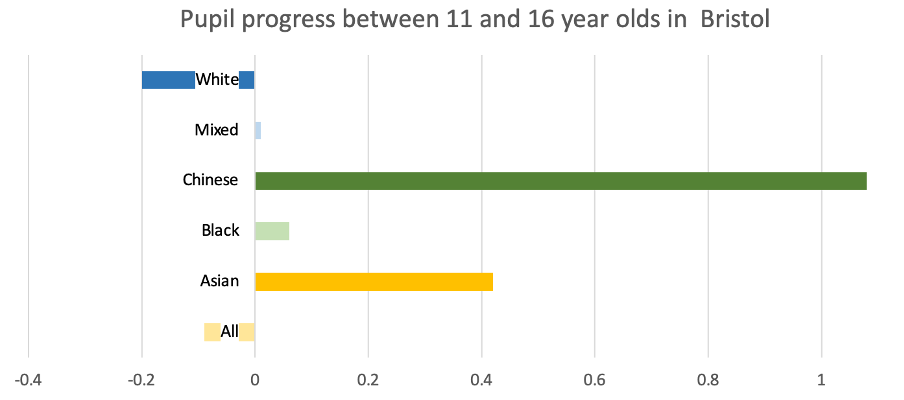
Pupil progress between 11- and 16-year-olds ('Progress 8')
GCSE English and maths attainment
GCSE attainment (Attainment 8)
English Baccalaureate entry
English Baccalaureate achievement
Absence from school
Temporary exclusions
Permanent exclusions
ONS
Age by highest level of qualification by sex by country of birth
RDA

© RDA - Graph courtesy of RACE.
This graph shows the percentage of children who meet the expected level of development during their reception education. It is measured at the end of the school year in which children turn 5 year old. In Bristol 70% of all students met the standard. 82% of Chinese students met this standard whereas only 59% of black students met the standard.

© RDA - Graph courtesy of RACE.
This graph shows the reading, phonetic, mathematic, writing and science attainments of children aged 6-7 in Bristol by ethnicity. Chinese children consistently achieved higher attainment within all categories with their lowest attainment being 83% in reading. Children from the other ethnicity category achieved the lowest level of attainment with 57% of students reaching the expected standard. All other ethnicities performed similarly to each other with no less than 60% of students reaching the expected standard in any subject area.

© RDA - Graph courtesy of RACE.
This graph shows the reading, mathematic, writing and grammar attainments of children aged 10-11 in Bristol by ethnicity. Chinese children reached the highest level of attainment with 100% of Chinese students reaching the expected standard of mathematic ability. No ethnicity saw an attainment value less than 60% with the lowest value being black children’s attainment in reading (64%).
© RDA - Graph courtesy of RACE.
This graph shows Bristol student progress in relation to the average result (shown as 0 in this visualisation). This graph shows that all ethnicities except white had an above average progress score with Chinese students being 1.08 above average. The group with the lowest average progress level was white where 2,062 averaged a score 0.2 below average.

© RDA - Graph courtesy of RACE.
This shows the attainment 8 score of Bristol students. Attainment 8 measures the results of pupils at state-funded mainstream schools in 8 GCSE qualifications. These must be English, Maths and out of the remaining 6, 3 must come from languages, sciences, history, or geography and the other 3 can be either from GCSE qualifications or technical awards. Each pupil is graded from 1-9 per subject. Their scores from all 8 subjects are then added with English and Maths counting twice to get an attainment 8 score for a pupil. The average score for all Bristol pupils was 48.6. Chinese students saw a score of 66.8 whilst Black students achieved a below average score of 43.

© RDA - Graph courtesy of RACE.
This graph compares the difference in English Baccalaureate entry and achievement in Bristol schools by ethnicity. This means students have achieved a grade higher than 5 in English, Maths, Science, a language, and either history or geography. In every ethnicity, the percentage of entries were much greater than the percentage of students that achieved the Baccalaureate. The largest difference between entry (44.9%) and attainment (7%) was seen with black students with a difference of 37.9%. This means that 84.4% of entered Black students failed to achieve the requirements. Chinese students had the highest level of attainments with 23.1% of students achieving the baccalaureate requirements (over 50% of entrants)

© RDA - Graph courtesy of RACE.
This data shows absences within Bristol schools by ethnicity. The overall absence rate is the total number of authorised and unauthorised absences as a percentage of the total number of possible sessions at school. There are usually 2 sessions in a school day, in the morning and afternoon (GOV.UK, 2020). From this data, we can see that 4 ethnicities (other, white, mixed and Asian) had over 5% absences with mixed children having the highest absence rate at 6%. However, Chinese children were absent the least at 2.8%.

© RDA - Graph courtesy of RACE.
This graph shows the rate of temporary exclusions by ethnicity. To be considered as a temporary exclusion a student can be excluded more than one time as long as the total length of exclusion doesn’t exceed 45 days per academic year. The data shows that mixed ethnicity students were temporarily expelled at a rate of 11.84 whereas Chinese students were expelled at a rate of 1.11.
The exclusion rates are calculated using the number of pupils in January each year and the number of exclusions in the whole academic year. So in this case, a white rate of 7.12 means for every 100 white students, 7 are temporarily expelled.

© RDA - Graph courtesy of RACE.
To be considered as a permanent exclusion, it means that the pupil cannot return to their school. White students saw the highest permanent exclusion rate with 4 pupils per 100 being excluded. Chinese, Asian and black students all saw a rate of 0.