
work
The work data below is sourced from NOMIS, a serviced provided by the Office for National Statistics, National Government’s Race Disparity Audit (RDA), the Department for Work and Pensions (DWP), and includes raw data as well as graphs and data summaries covering the following areas:
NOMIS
Distance travelled to work
RDA
Employment
Unemployment
Economic inactivity
People claiming jobseeker’s allowance
Length of time claimed for
JSA sanctions
DWP
Employment and support allowance
Mean of weekly award amount
Households below average income
nomis

© NOMIS - Graph courtesy of RACE.
This graph shows the average distance travelled to work by ethnicity in the South West. 507,796 people travel less than 2km with 95.3% of these being white and 0.88% being black. On the other end of the scale, 96,135 people travel over 60km to work with 95% being white and 0.3% being from the group “other”.

© NOMIS - Graph courtesy of RACE.
This graph shows the average distance travelled to work by ethnicity in Bristol. 46,027 people travel less than 2km with 87.5% of these being white and 0.59% being from the other category. On the other end of the scale, 6,874 people travel over 60km to work with 87% being white and 0.15% being from the group “other”. All ethnicities saw a majority of their population living between 2 and 5 km from work at around 20-30% of each ethnicity.

© NOMIS - Graph courtesy of RACE.
This graph shows the method of travel to work by ethnicity in the Southwest. The graph shows that in all ethnicities, between 40 and 60% of people travel by driving. This is highest in the white and White: English/Welsh/Scottish/Northern Irish/British categories at 59% and 60% respectively. The method of travel with the lowest uptake amongst all ethnicities is Train with around 1-2% of each ethnicity using it as their method of travel.

© NOMIS - Graph courtesy of RACE.
This graph shows the method of travel to work by ethnicity in Bristol. The graph shows that in all ethnicities, between 37% (white other) and 49% (white) of people travel by driving. The next most popular method in all ethnicities is on foot which ranges from 18% of white residents to 23% of white other residents. Around 10% of people from all ethnicities worked mainly from home at the time of this sample in 2011.
rda

© RDA - Graph courtesy of RACE.
This graph shows us that the total employment rate in Bristol is just under 77%. When comparing between white and non-white individuals, the employment rate is nearly 10% less for those that are ‘other than white’.
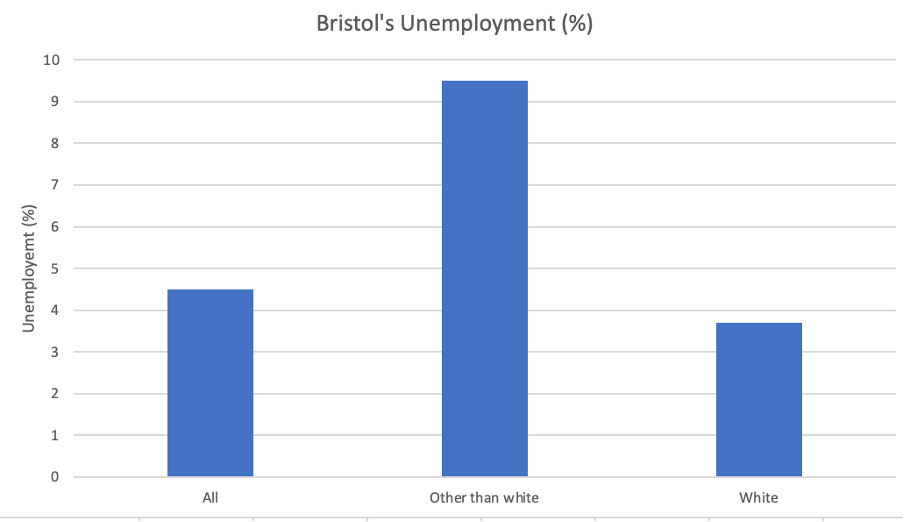
© RDA - Graph courtesy of RACE.
This chart shows that the total unemployment rate in Bristol is 4.5% which is inline with the current nationwide value of 4.1% (Office for National Statistics, 2021). However, when filtering by ethnicity, you can see that the percentage of white people who are unemployed is below the total rate at 3.7% whilst the other than white category sees an unemployment rate of 9.5%.

© RDA - Graph courtesy of RACE.
This graph shows that all ethnicities in the South West are experiencing employment levels higher than 65%. Those in the ‘white and ‘white other’ categories have the highest employment levels at around 80% whilst the ‘other’ category has the lowest value at 68%. The Pakistani, Bangladeshi value was missing from the raw data and therefore has not been plotted.

© RDA - Graph courtesy of RACE.
This chart shows there are 87,900 people unemployed in the South West with 78,000 of these people being White and 10,000 being in the other than white category. This means that of all unemployed people in the South West, 11% of them are non-white.

© RDA - Graph courtesy of RACE.
This graph shows the economic inactivity in the City of Bristol. Economic inactivity is defined as people of working age (16-64 years old) who are out of work, not actively looking for work, not waiting to start a job, not in full time education, caring for their family or retired (Gov.uk, 2021). The Bristol total inactivity rate was just under 20% but when separated by ethnicity, 24.1% of those in the ‘other than white’ category were considered inactive whilst 18.9% of people in the ‘white’ category were economically inactive. Whilst both of these values are similar to the city-wide value, there is a difference of 5.2% when considering ethnicity.

© RDA - Graph courtesy of RACE.
This chart shows that in the South West, 0.7% of white people claim Job Seekers Allowance whilst 1.1% of people who are other than white claim Job Seekers Allowance. However, this data doesn’t include any claimants whose applications are on paper rather than within the centralised computer system. This had led to around 1% of all claims being omitted and could skew the above data slightly (GOV.UK, 2018).

© RDA - Graph courtesy of RACE.
This chart shows the percentage of people who claimed Jobseeker’s allowance (JSA) for over 104 weeks. The lowest value on the chart is 11.9% of people claiming JSA for more than 104 weeks in the Southwest were Asian whilst the unknown category holds 24% of people within this category.
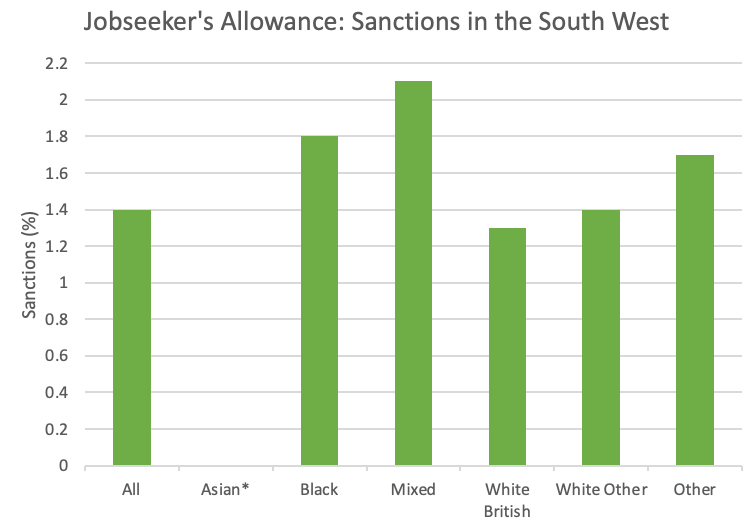
© RDA - Graph courtesy of RACE.
This data shows the percentage of decisions to sanction people receiving work-related Jobseeker’s Allowance (JSA). “A sanction is when someone claiming JSA has their benefit reduced if they don’t do something they’re asked to do by their Jobcentre adviser without good reason, for example, if they don’t accept or keep to their agreement to look for work.” (GOV.UK, 2017) The percentage of all JSA claimants who had their allowance sanctions in the South West was 1.4%. When breaking this into ethnicities, the mixed category saw the highest value of 2.1% of their JSA claimants sanctioned whilst the lowest percentage of claimants sanctioned was white British at 1.3%. The value for ‘Asian’ was missing from the raw data so was omitted from the above visualisation.
dwp
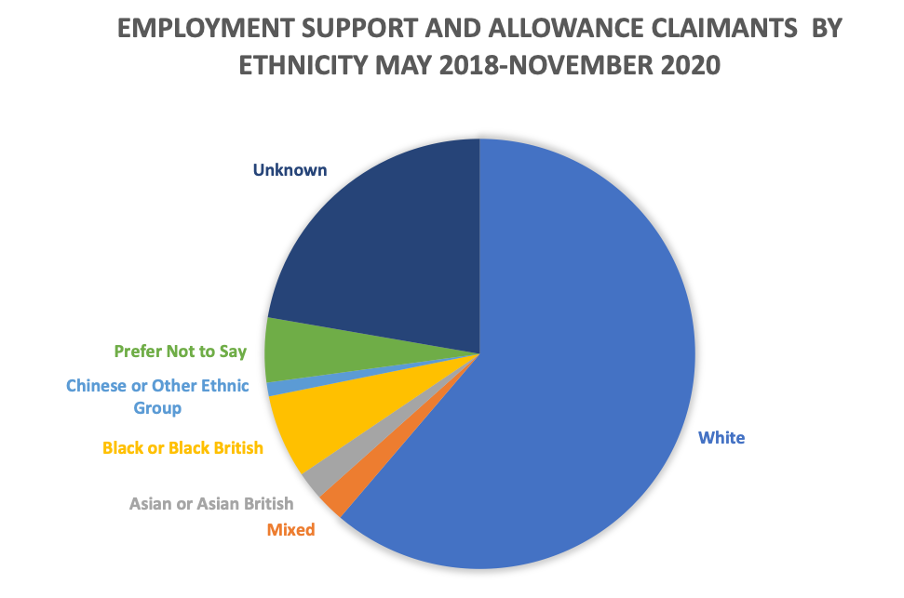
© DWP - Graph courtesy of RACE.
This graph shows the ethnic spread of employment support and allowance claimants between May 2018 and November 2020. Of all claimants during this period, 61.24% were white with all other groups (except unknown) accounting for under 10% each.

© DWP - Graph courtesy of RACE.
This graph shows the average weekly amount (in pounds) that is paid in employment and support allowance in Bristol from May 2018 to November 2020. The general trend is that all ethnicities saw an increase in their allowance value over time. Asian or British Asian people saw the lowest values of weekly payments ranging from £122.51 in May 2018 to £135.17 in August 2020. The highest value seen in the chart is the Black/Black British values in August 2020 of £147.48 which also saw the greatest increase during the time period of a total £17.46 over the time period.

© DWP - Graph courtesy of RACE.
This graph shows the average weekly amount (in pounds) that is paid in employment and support allowance in the Southwest from May 2018 to November 2020. Apart from the Unknown group, all ethnicities saw a general increase in their weekly payments. The highest value was the November 2020 Black/Black British at £147.38 per week.

© DWP - Graph courtesy of RACE.
This data shows the number of households below or above the income threshold which in this case is defined as a household having an income worth 50% of the median UK income. For example, if the median UK salary was £30,000, any household whose income was below £15,000 would be classed as low income. These figures were calculated before household costs (BHC). Of all white households 91.6% were above the threshold and therefore not classed as in low income. In contrast only 37% of black households were below the threshold. Both Asian and Mixed households saw nearly 90% of their household being above the threshold at 89.4% and 94.3% respectively.

© DWP - Graph courtesy of RACE.
This data shows the number of households below or above the income threshold which in this case is defined as a household having an income worth 60% of the median UK income. For example, if the median UK salary was £30,000, any household whose income was below £18,000 would be classed as low income. These figures were calculated before household costs (BHC). 94.32% of all mixed ethnicity households were above the threshold and classed as not in low income whereas 69.4% of Black households were below the income and therefore in low income. All other ethnicities had over 70% of their households not in the low income category.

© DWP - Graph courtesy of RACE.
This data shows the number of households below or above the income threshold which in this case is defined as a household having an income worth 70% of the median UK income. For example, if the median UK salary was £30,000, any household whose income was below £21,000 would be classed as in low income. These figures were calculated before household costs (BHC). Of all Asian households 78.72% were above the threshold which is similar to white and other who had 77.96% and 75.39% of households respectively above the threshold. Mixed and black households saw 5.68% and 9.03% of households above the threshold.

© DWP - Graph courtesy of RACE.
This data shows the number of households below or above the income threshold which in this case is defined as a household having an income worth 50% of the median UK income. For example, if the median UK salary was £30,000, any household whose income was below £15,000 would be classed as in low income. These figures were calculated after household costs (AHC). All ethnicities except Black and other saw over 80% of their households being above the given threshold. 97.11% of mixed households were above the threshold whereas 37.09% of Black households were in the same category.

© DWP - Graph courtesy of RACE.
This data shows the number of households below or above the income threshold which in this case is defined as a household having an income worth 60% of the median UK income. For example, if the median UK salary was £30,000, any household whose income was below £18,000 would be classed as in low income. These figures were calculated after household costs (AHC). Here White (82.25%), Mixed (94.32%) and Asian (82.14%) saw the highest percentage of households being above the threshold. Only 9.03% of black households were in the not in low income category.

© DWP - Graph courtesy of RACE.
This data shows the number of households below or above the income threshold which in this case is defined as a household having an income worth 70% of the median UK income. For example, if the median UK salary was £30,000, any household whose income was below £21,000 would be classed as in low income. These figures were calculated after household costs (AHC). The only ethnicities that see a change in this graph compared to where the threshold is 60% if median UK income is White and mixed who fall to 74.93% and 83.65% respectively.

© DWP - Graph courtesy of RACE.
This chart shows the economic inactivity rate in the Southwest. The total inactivity is 18% of the population in the southwest. When separated by ethnicity we can see that the other than white category has 4% more people inactive than in the white category.